There are lots of theories about what causes unhappiness. Stress, loneliness, the fact that a silent film won best picture while Drive wasn’t even nominated.
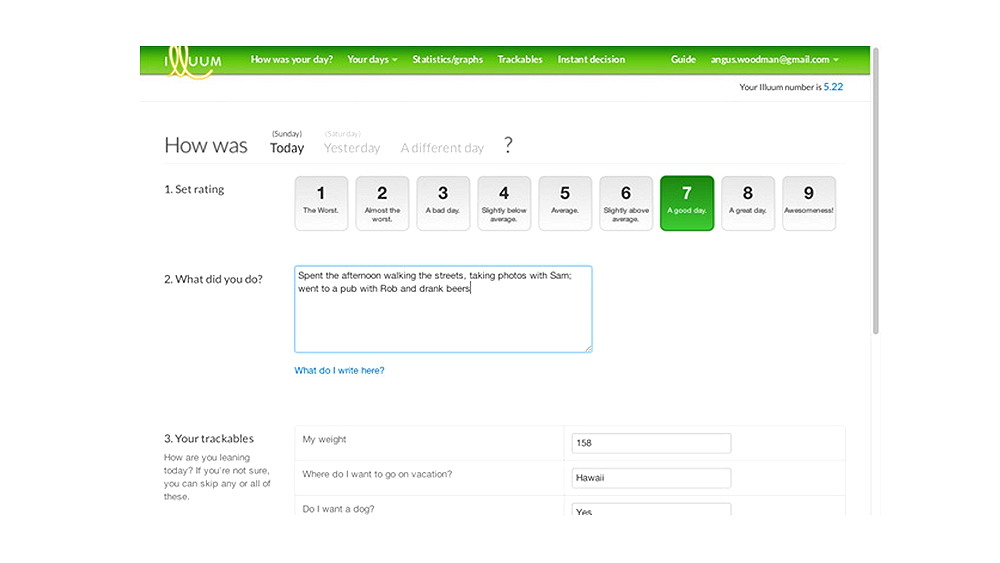
If you’re looking for some personal insight, Illuum ranks your day on a scale of one to nine with room for notes on why you felt the way you did. It then churns all that data to plot your mood swings and surface your happiest days of the week.
And if you’re suspicious something in particular is causing the seemingly random pangs of glee (or lack thereof), add Trackables to see if the rainy weather or that giant chocolate bar you ate are skewing results. If even that doesn’t settle it, the Instant Decisions option might be able to put the issue to rest.
At the end of every month, Illuum corrals the anonymous data into some insightful infographics and interesting findings on how our collective moods swing on the same set.
Nice to know we’re not alone.


